Faster builds with highly parallel GitHub Actions
It’s a near-universal truth of continuous integration builds: no matter how fast they are, they’re just never quite fast enough.
On the Testcontainers project, we feel this pain particularly acutely. Testcontainers is an integration testing tool, so to test it accurately we have to have a wide set of integration tests. Each integration test can involve pulling Docker images, starting up servers and waiting for them to be ready. To make things even more difficult, we support a fairly eye-watering range of integrations. For example, just for our database support we have to test against 14 different databases, ranging from lean to … pretty heavyweight.
This all adds up to a very long build!
As a humble open source project without commercial backing, we’re also keen to keep costs down. This means we rely on the generosity of cloud CI providers’ free plans, which are often resource constrained.
Build optimisations in the past #
In total, we currently have 51 Gradle subprojects within our build. A couple of core components are depended upon by a range of modules, each of which is a Testcontainers implementation for a particular product.
Long ago, we managed to eliminate some of the build time using the myniva/gradle-s3-build-cache remote Gradle cache plugin. Every build on our master branch populates a globally-readable Gradle cache, so that CI jobs and developers working locally do not need to rebuild, or retest, unchanged modules. This improved our best-case build performance — if most of the 5 jobs did not involve changes, they would be fairly short. But a change to the core module (that all others depend upon) would cause all 5 jobs to run a full rebuild of their modules.
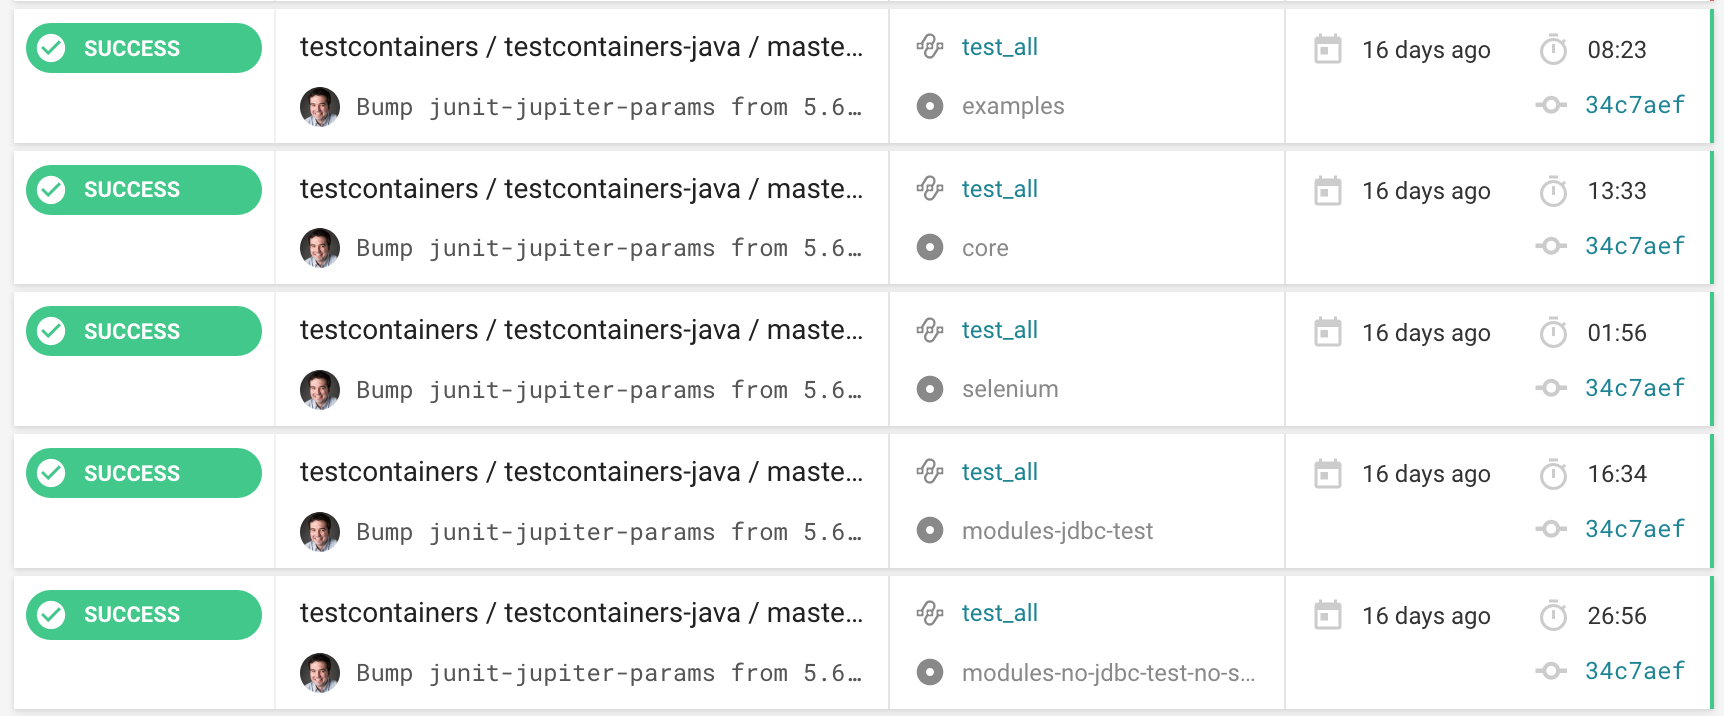
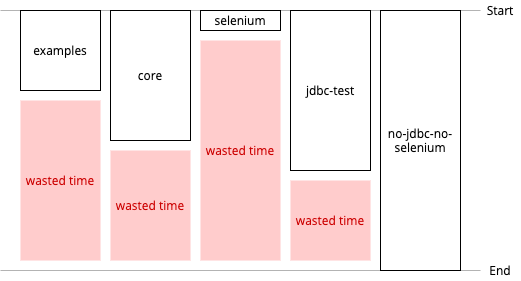
At another point in the past we had manually defined 5 separate jobs on our primary CircleCI build: core, examples, selenium module, jdbc modules, and a no-jdbc-no-selenium module — basically everything else.
These jobs might have been reasonably balanced back then, but over time as we’ve added user-contributed modules some build jobs have grown. For example, the no-jdbc-no-selenium job was a whopping 27 minutes if a full build was required.
We obviously needed to re-balance our parallel build jobs — that is, do a better job of bin-packing our Gradle subprojects into a set of parallel jobs. We could do that manually, right? Well, it might work at first, but it seems inevitable that we’d end up in a similar situation one day as we add new modules or test durations evolve. We quickly realised that we could do better.
Leave the bin-packing to a queue #
What if we essentially adopted queue-based load leveling: split our build into far more than five jobs, and let the CI executors compete to pick up new jobs as soon as there’s capacity? Our bin-packing problem would be solved automatically, without up-front design.
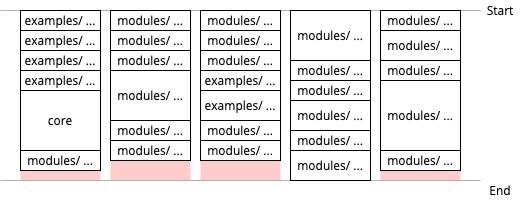
If we were to create a distinct build job for each Gradle subproject, we could achieve the tightest bin-packing:
Iterative implementation #
We chose to try this pattern as part of our work to migrate our main CI jobs to GitHub Actions.
An initial (hacky!) bash script proved the concept. The script generated a massive workflow YAML file with a job that would run the check task in each Gradle subproject. In theory, this bash script could be run periodically, whenever a new subproject is added to our build. But we could do better than that!
We quickly iterated on this, exploiting an extremely powerful feature of GitHub Actions workflows: dynamic build matrices. Simply put, this allows one job in a workflow to programatically generate a matrix of parameters to be run in a subsequent job. The GitHub Actions documentation gives an example.
Our implementation looks a little like this (summarized):
{% raw %}
name: CI

on:
  pull_request: {}
  push: { branches: [ master ] }

jobs:
  find_gradle_jobs:
    runs-on: ubuntu-18.04
    outputs:
      # Declare our output variable
      matrix: ${{ steps.set-matrix.outputs.matrix }}
    steps:
     ...
      - id: set-matrix
        # The below outputs a JSON array of check tasks for each subproject
        #  and uses GitHub Actions magic (::set-output) to set an output
        #  variable
        run: |
          TASKS=$(./gradlew --no-daemon --parallel -q testMatrix)
          echo $TASKS
          echo "::set-output name=matrix::{\"gradle_args\":$TASKS}"
  check:
    # We need the other job's output
    needs: find_gradle_jobs
    strategy:
      fail-fast: false
      # Read the variable, parsing as JSON, so that `matrix` becomes a
      #  list of check tasks
      matrix: ${{ fromJson(needs.find_gradle_jobs.outputs.matrix) }}
    runs-on: ubuntu-18.04
    steps:
     ...
      - name: Build and test with Gradle (${{matrix.gradle_args}})
        # Matrix execution will cause the below to be run many times,
        # one for each check task to be run
        run: |
          ./gradlew --no-daemon --continue
          --scan --info ${{matrix.gradle_args}}
{% endraw %}
The testMatrix task is a custom task which emits the list of subprojects’ check tasks in JSON format, and looks like:
task testMatrix {
    project.afterEvaluate {
        def checkTasks = subprojects.collect {
            it.tasks.findByName("check")
        }.findAll { it != null }

        dependsOn(checkTasks)
        doLast {
            ...
            println(JsonOutput.toJson(checkTasks))
        }
    }
}
Part of the list of build jobs generated on-the-fly
As a result of this small amount of script work, we have an automatically generated list of jobs for GitHub Actions to execute.
This list will never go out of date, because it is based on Gradle’s own view of the subprojects.
It gets better #
Testcontainers co-maintainer Sergei Egorov is a Gradle magician, and delivered the icing on the cake…
With our new dynamic matrix in place, we’d have a job for every Gradle subproject. Many of these might execute quickly if they found that a cached result already existed. It’s perhaps a little wasteful to have CI jobs that do nothing, though.
Sergei quickly realised that Gradle’s build cache mechanism already has the ability to detect which subprojects have been modified or need to be tested. This could be used by our testMatrix task, to avoid generating a CI job altogether for unchanged modules. After some amendments, the final testMatrix task works extremely well in preventing unnecessary CI jobs. For example, changes to documentation or ‘leaf-node’ modules can execute in a far faster timeframe.
Summary: What have we done? #
-
Gradle’s own project structure is used to generate jobs to be executed by GitHub Actions. This gives us parallelizable jobs for every Testcontainers module, without manual effort to keep CI configuration in sync.
-
A remote Gradle build cache holds intermediate task outputs, meaning that the CI jobs that we run don’t do unnecessary work.
-
Peeking at the Gradle build cache status lets us bypass unnecessary CI jobs entirely, avoiding wasted setup/teardown time and keeping our build queue short.
-
Additionally, we want to keep CircleCI and Azure Pipelines builds for compatibility testing — to essentially demonstrate a configuration that works with these CI platforms. However, we’ve reduced these builds to a bare minimum, and now rely on GitHub Actions as the primary source of truth for our build health.
The results so far #
In short, we’re seeing massive improvements in build times for PRs 🎉
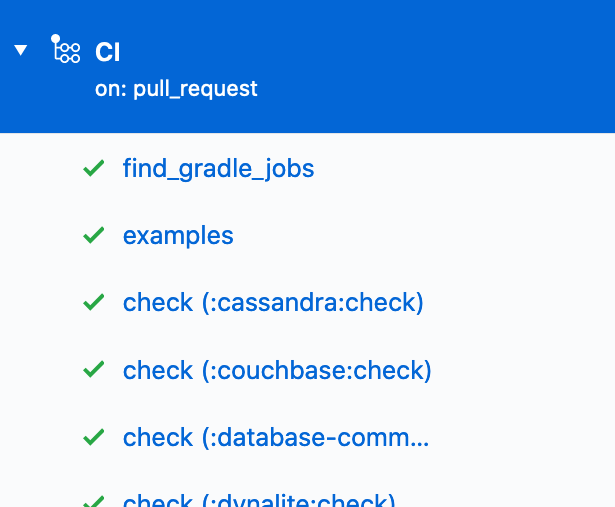
Here’s one example, a dependency bump in the Localstack module. Like many PRs, this affects a single module:
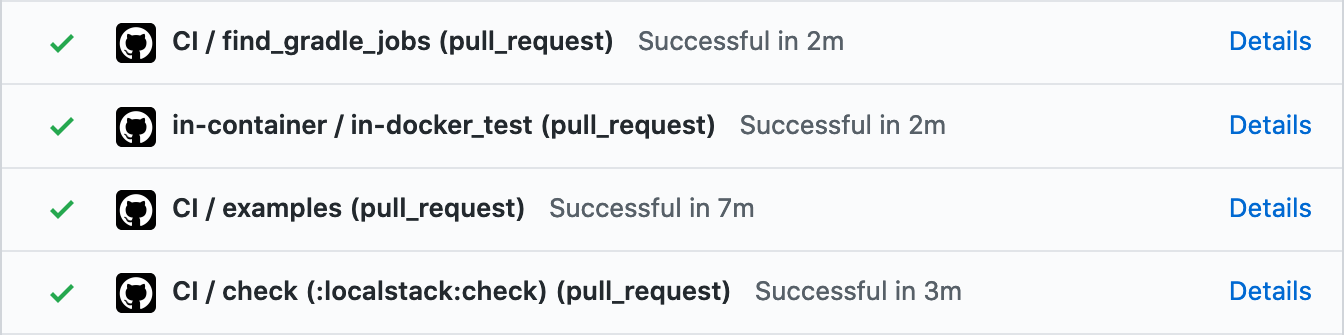
We can see:
- Among our ‘CI’ jobs,
find_gradle_jobsdiscovers which CI jobs need to be run, taking 2 minutes. - The only ‘CI’ job needed is
:localstack:check, which completes in a further 3 minutes. - We also run
in-dockertests — these don’t contribute to the total build time as they run in parallel.
As-is, this PR had complete feedback in 5 minutes — a drastic reduction from the build times we were seeing previously!
We perceived that build times had improved, but is this truly the case? Let’s analyse some recent builds.
Quantitative analysis #
Is there an improvement upon our original build jobs? #
The plot below compares build time duration between our previous and new CI jobs. As hoped for, and matching our subjective experiences, there is a dramatic improvement:
- p25 and p50 build duration has dropped, with the median duration down from nearly 14 minutes to just over 8 minutes
- p75 build duration has come down by approximately 5 minutes (and we think there’s further room for improvement — see later)
- max build duration has dropped from a dizzying 21 hours to around 45 minutes. This is not an error; the volume of builds generated by our dependabot version bumps did, on occasion, cause build jobs to become enqueued for nearly a full day. This major annoyance has gone away with the migration.
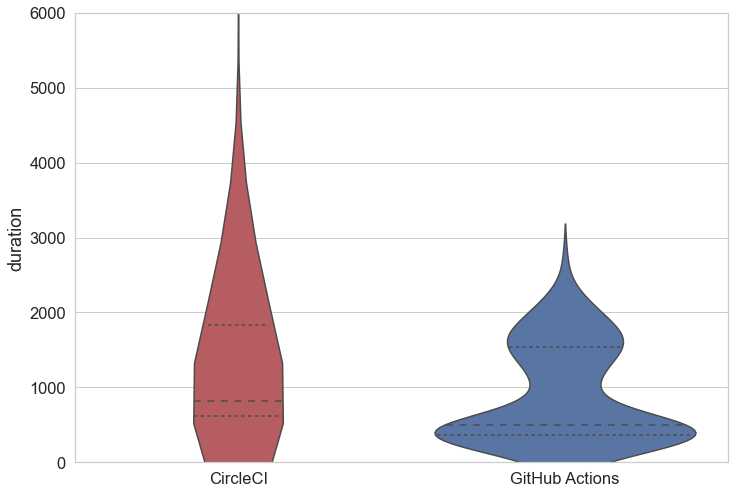
| min | 25% | 50% | 75% | max | |
|---|---|---|---|---|---|
| CircleCI | 35 | 615 | 824 | 1831 | 75814 |
| GitHub Actions | 79 | 365 | 500 | 1539 | 2711 |
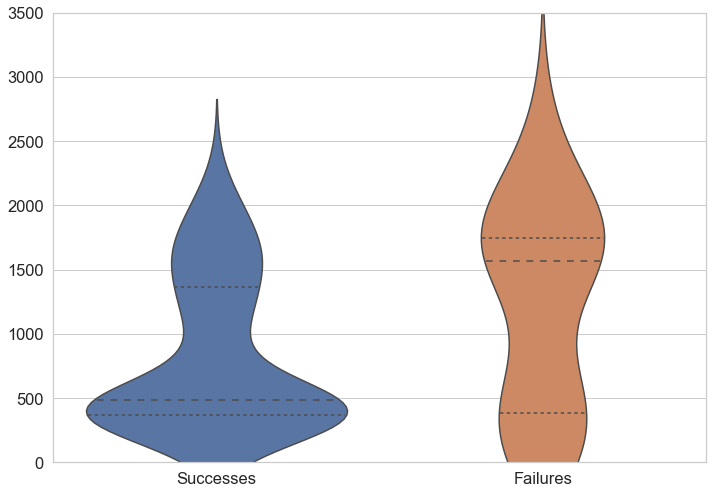
Is there a difference in run duration between successful and failed builds? #
CI builds have two roles to play: providing assurance that a PR/commit is reliable, and providing a signal when it is not. Clearly we’d like both of these scenarios to be quick.
Intuitively, PRs without many changes will tend to run the fewest tests and succeed more often. This appears to be the case in our data. Builds that go on to fail tend to take longer to do so.
We’re happy that many successful builds complete quickly, but less happy that there’s slower feedback for build failures.
What are the slowest modules to build? #
Recall that our no-jdbc-no-selenium ‘miscellaneous modules’ build used to be the longest running, at up to 27 minutes. Having split into more parallel modules, we’ve removed this bottleneck on our build performance, but has the bottleneck shifted elsewhere?
Analysing our new build durations on a per-module basis we can see that it has indeed:
| duration | jobname | |
|---|---|---|
| median | count | |
| jobname | ||
| check (:testcontainers:check) | 1123.0 | 62 |
| check (:mysql:check) | 513.0 | 54 |
| check (:selenium:check) | 484.0 | 53 |
| check (:db2:check) | 436.5 | 54 |
| check (:ongdb:check) | 404.0 | 1 |
| check (:mariadb:check) | 343.5 | 54 |
| check (:presto:check) | 331.0 | 55 |
| check (:cassandra:check) | 322.0 | 53 |
| additional_checks | 311.0 | 1 |
| check (:docs:examples:junit4:generic:check) | 288.0 | 50 |
We can see that the :testcontainers:check build job (which is our core module) now takes the longest to build, with a median duration of around 19 minutes. This means that our build time for PRs that modify the core module are still going to take at least this much time, even though the other modules will quickly run in parallel.
Not every PR touches core, but when they do it’s likely to take some time.
We believe this accounts for the ‘bulge’ of build durations seen in our distribution plots above between 1000-1500 seconds — which we’d like to try and remove.
So, with this in mind, our next steps will focus on the core module’s test performance: making our tests more efficient, or splitting the module’s tests in a way that helps us run them in parallel.
Conclusion and next steps #
- Splitting our build into more parallel jobs has improved build duration for all builds, with the majority seeing a big improvement.
- The Gradle remote build cache helps avoid running builds/tests when it is not necessary.
- GitHub Actions dynamic job matrix support is extremely powerful and allows builds to be defined programmatically.
- GitHub Actions’ free tier is surprisingly generous and helpful for open source projects!
- While we’ve achieved good improvements to our build time, we want to go further on the path of parallelisation.
Go forth and parallelise!